The momentum look-ahead shock-point of the wave is the causational origin of friction increasing . . . producing in general:
- the slowing of momentum
- price penetration of the wave leg
- generation of the friction zone discussed under the earlier chapter Friction
- a momentum origin ~3 to 5 bars earlier than friction origin of Sacred Cut
These momentum shock-points create look-ahead differential vectoring, thus generating a Fib Structure in terms of both Price and Time.
Short videos below demonstrate ‘Fib Price Levels’ (in the wave) as generated at momentum shock-point:
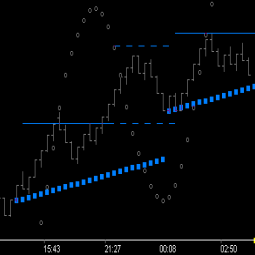
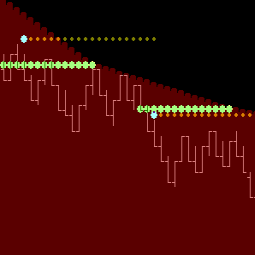
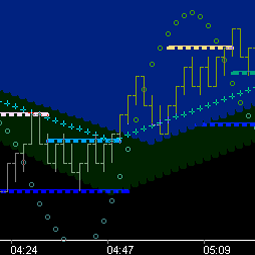
- Trough Fib_Zero Price Level (showing from Fib Cnt_5 to Fib Cnt_13)
Make note while viewing the above video that not a single Trough Fib_0 level is penetrated, and successive Fib_0 levels are dropping lower. (ie no upside breakouts, lower hi’s/lower lo’s . . . Note: Trough Fib_0 serves to Cap the Crest of the Wave . . . which price must break above to break-out and start producing higher hi’s/higher lo’s)
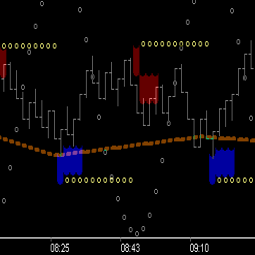
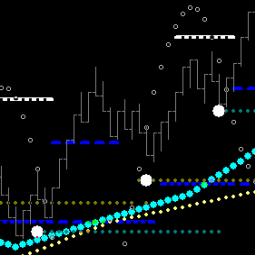
Since both 13 & 21 are powerful corners (lying on the 45 diagonal of the Square of 9, as discussed under the Directional Bias chapter), it is desirable to know where these important Fib points in time are. Below pic shows the addition of a 2nd marker (blue) at the Trough Fib_0 level, running from Fib Cnt_13 to Fib Cnt_21.

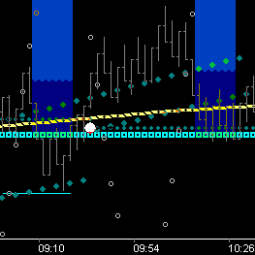
Consider what price (the market) knows about the Fib_0 level at 6:31. It knows that it is also below Fib_0 level of the prior cycle, which can easily be seen in the above pic . . . or . . . the Fib_0 level can be extended to Fib Cnt_34.

Which serves to remind the trader what price would have to do to break-out, making that point in real-time a significant trade threshold. However, this is a very incomplete picture thus far (being shown just one step at a time to aid in the comprehension process). What’s true about market vibration is that price is consistently finding it’s way to achieve or complete these Fib_0 price levels . . . and more specifically . . . the Fib_8 price level (Fib_5 on a smaller fractal).

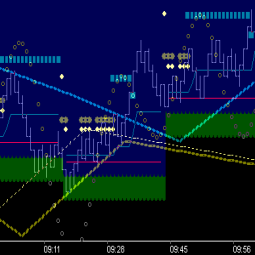
The correct trade is to take advantage of price’s proclivity to accomplish these levels. In order to do that we have to have support for a trade entry with known reward/risk. Perhaps it would make sense to use our Square of 9 knowledge gained thus far and checkout the Fib_21 level for support.

As you think about the targeting mechanism the pic above represents, it may be of interest to study again the Square of 9 chapter and check to see where count 8 exists in the spiral . . . ie 270* . . . and it could be true that the vibrational target ‘zone’ of this structure lies anywhere between 5 and 9 . . . the ‘other’ 45 diagonal (135* to 315*).
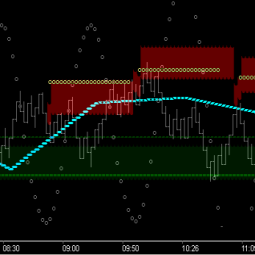
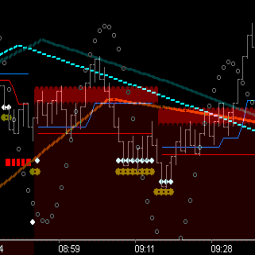
It should make sense, because of the wave length of the wave (26), that the 13 to 21 count (time) of the Trough Fib structure overlaps the 5 to 13 count (time) of the Crest Fib structure, and that the same 13 to 21 count of the Crest Fib_0 level can be shown . . . and extended to Cnt_34.

And of course it must follow that Crest Fib_21 should show the same resistance property for Crest Fib_8 targeting as the Trough force does, ie ‘Equal and Opposite’.

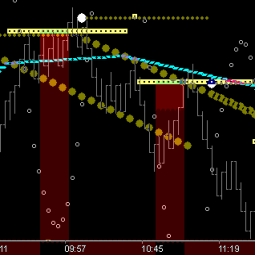
Which it does . . . however, make note that in general, it is inappropriate to show opposing force ‘targeting details’ on the same chart. Trade focus must be maintained on the chart(s) which are in sync with current directional bias . . . and of course . . . that directional bias may be coming from a larger fractal. In this case, I would prefer to see upside targeting with Crest Fib structure showing zone of resistance (using the Crest Fib_17 level).

Study the above chart closely. The Crest Fib_21 (red) is running from Cnt_0 to Cnt_34 and Crest Fib_17 is running from Cnt_13 to Cnt_34 (dark red). Now since the wave length is 26 . . . the Fib_21 level is consistently going to shift to new Crest Fib_21 Level at new Cnt_0 at ~Cnt_26 of the prior cycle. Structuring charts like this shows clearly, in advance, what price has to do to break-out and for continuance.

Now that we understand elemental components of the Fib Price/Time structure:
- Momentum Look-Aheads produce Fib Time Origin (Count Zero)
- Trough Fib_0, Fib_8, Fib_21, Fib_17, etc.
- Crest Fib_0, Fib_8, Fib_21, Fib_17, etc.
- Counts 5-13, 13-21, 13-34, 0-26, etc.
We’re ready to watch the ‘Fib Price Levels’ (in the wave) video again . . . now with an understanding of where price is at in relation to time: