All vibration occurs as elemental components react to their position (relationship) relative to both the past and the future . . . and both of these only have meaning as a function of Time.
The elemental component of vibration in the markets . . . ‘Price’ . . . is no different. Support and Resistance of both the past and the future are constantly invoking stop and start points of price movement. And remember, as revealed in the Friction chapter, every component of vibration has it’s opposite force . . . the above (Crest) and below (Trough).
So each force has time components which price can be above or below . . . and because of this . . . price spends a majority of it’s time bracketed by opposing forces. This fundamental makes it very difficult and complicated to ‘read’ the intent of price action . . . unless you understand the principles of time in market vibration. It should make sense then that for success in trading . . .
Visualization of this framework of Time is imperative . . .

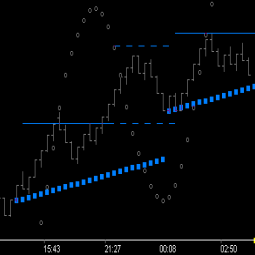
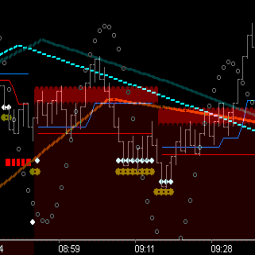
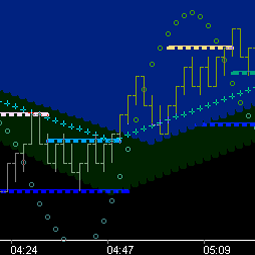
because Time (past and future) gives clear perspective to prices relationship with now. It should speak to you loud and clear when you understand that the larger fractal chart above is showing Crest Tm45 (brown) and Trough Tm45 (cyan).
Embrace this and succeed . . . addition of Crest and Trough Time Fences (vectors), to any chart fractal, will enhance the trader’s mental clarity/ability to take advantage of the inherent momentum fundamentals of these time levels:
- Price above Trough Fence(s) has upside momentum. Expect to see follow through to upside targeting. Price action to the downside is specifically retracement into time/price thresholds . . . the point of continuance/change. Trade for continuance to the upside. Price will consistently bracket itself when directional bias is changing.
- Price above Crest and below Trough Fences is bracketed. Price will tend to find its way to the other side of the bracket once it is bracketed.
- Price below Crest Fence(s) has downside momentum. Expect to see follow through to downside targeting. Price action to the upside is specifically a retracement into time/price thresholds . . . the point of continuance/change. Trade for continuance to the downside. Price will consistently bracket itself when directional bias is changing.
- In most cases, the smaller fractal chart(s) will forecast what the larger fractal is getting ready to do . . . continue vs. change.
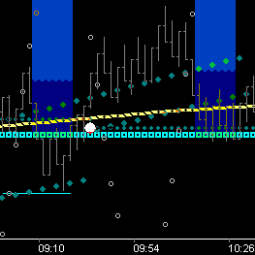
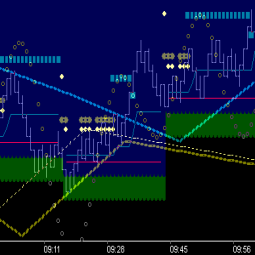
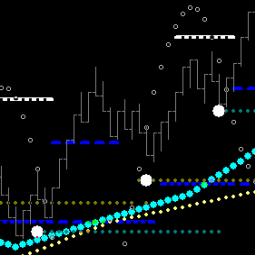
With this understanding, let’s review our previous gNomonic example adding 1st the Trough Time Fence Momentum perspective . . .

and understand that output of the gNomonic ‘below” side is being filtered by this Trough fence structure . . . specifically the Tm26/Tm21 fences. (remembering that wave length is 26, the gNomonic cycle length chosen for study was 26 and 21 is an important corner and a proxy for 45). Note the resistance these fences provided at ~9:05 with below target in play and remember this was exactly where the the above target was triggered. This should be reinforcing for you the relationship perspective of why gNomonic targets are typically retraced from when triggered . . . ie, when they are on the wrong side of time. Notice also the momentum move for above target completion was staged at ~9:20 as price consolidated and applied into the Trough fence crossover potential. This picture is completely enhanced with awareness that the Crest Tm26 fence is lined up at this same price level, as shown below.

Consider a couple of things:
- I use Trough Time Fences to filter the ‘below’ gNomonic output.
- All of this Time/Price framework is known well in advance and price reacts to these relationships as their confluence points occur.
- Attention is easily paid to the proof-point relationship price is consolidating into.
- Momentum up and down is a derivative of these crossovers.
- Unfortunately . . . most traders are geared towards trying to short the market when price is in the rulership of momentum up (price above Trough Time Fence), and trying to buy the market when price is in the rulership of momentum down (price below Crest Time Fence).
- It’s also true that most traders cannot trade a line . . . but that is because it is not a significant Time line relationship as demonstrated here.

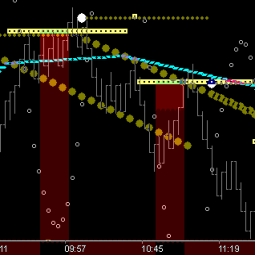
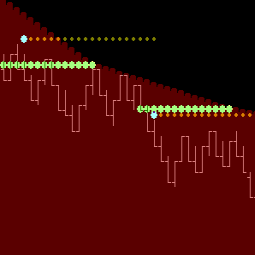
- I use Crest Time Fences to filter the ‘above’ gNomonic output.
- The pic shown above is showing Crest Tm45/Tm34 filtering. In general, using a larger Time Fence on the Crest side, in conjunction with gNomonic structure, inherently shows where the support levels are during the day. This of course is coupled with the understanding that price below the 45 is extremely negative.
gNomonic Expansion and Time Fences work exactly the same across all chart fractals and markets . . . Naturally! [. . . Next]