The Fib Framework of Time and Price provides consistent and unending focus to price’s position across all fractals and markets, thus yielding:
- Trade Direction clarity . . . provided by Fib Fence Levels (Slope and Fold-Over)
- Trade Entry opportunities . . . provided by Fib Support/Resistance Levels (w/Momentum)
- Trade Decision Management . . . provided by Targeting Levels (Reward/Risk)
- Proof-Point Logic . . . for continuance vs change
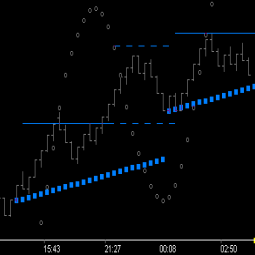
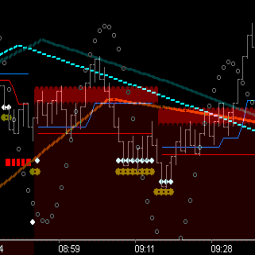
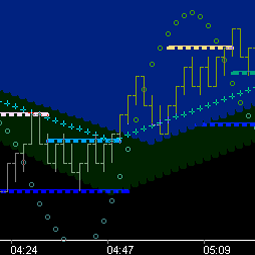
It should make sense that larger fractals paint a bigger picture as to price’s relative position and direction. We learned in the Fib Fences chapter that Trough Fib17_21 Fence . . . (that’s Price_17, Time_21) dominates directional bias and momentum of price (true on any fractal). Shown below on the Crude Oil (Large Fractal) 21 Tick chart, is the Trough Fib17_21 and Trough Fib21_21 fences.

Consider the difference between 12/12 and 12/13 in terms of directional bias. 12/12 is cupped with support of this fence structure and 12/13 is capped with resistance from the same. Large fractals give clarity to specific price levels and facilitate trade entry on smaller fractals that provide proof-point entries in sync with the bigger picture . . . as shown below.
(Note: Pivot Lo bar on 12/12 pictured above opened at 10:42:51)
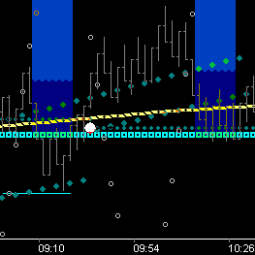
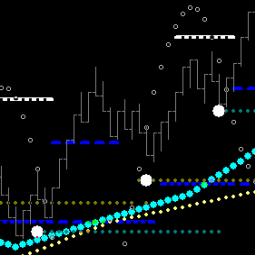
(Small Fractal) 5 tick chart (same Trough Fib17_21 Fence)

Trade Entry does not come from the larger fractal, but rather . . . when MOMENTUM on the smaller fractal agrees with the potential turning point (provided by the larger fractal), by rising above the proof-point level of the smaller . . . as shown above.
(Small to Medium Fractal) 8 tick chart (same Trough Fib17_21 Fence)

Check out the synchronous support level both the 5 and 8 fractals provided at 11:25 in the above 2 charts.
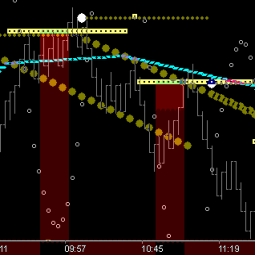
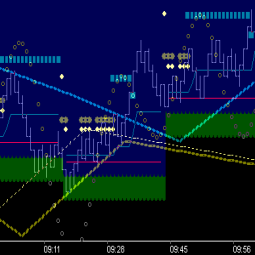
(Medium to Large Fractal) 13 tick chart (same Trough Fib17_21 Fence)

Every market has Key ‘medium-large’ Fractals that paint the ‘significant’ pictures of vibration (ie targeting, support/resistance levels, break-outs, etc). While smaller fractals are used for entries with momentum confirmation at timing crossovers (ref 5 & 8 charts above), medium fractals provide the significant Proof-Points for continuance in sync with the large fractals directional bias. On commodities such as Crude Oil, the 13 is a key fractal providing the trader significant threshold opportunities. The above chart shows clear momentum change with the Fence crossovers (as expected), . . . but there is much valuable information missing.
So we build the Trough perspective (upside momentum) to take advantage of this Key fractals relationship with the upside potential of the day. . . as revealed on the larger 21 fractal . . .
Adding Trough Fib_0 and Fib_8 Levels . . . ‘Targeting’ and ‘Gateway to Break-Outs’

Reinforcing price above Trough Fib17_21 Fence:
- is moving to and completing Fib_8 target levels (true on any fractal)
- has upside break-out potential through the Fib_0\Fib_8 GateWay (true on any fractal)

Reinforcing price relative to Trough Fib8_21 Fence:
- above is maintaining momentum break from prior cycle or (true on any fractal)
- crossing is breaking-out in route to next cycle Fib_8 target (true on any fractal)
- falling below is resting and establishes proof-point level price would have to overcome to again be in a break-out position (true on any fractal)
Zone Display Options:

Make it your own . . . whatever reinforces trading on the right side of momentum. Coloring Key Fences as Zones can facilitate clarity.
Adding Trough Fib_21 Price Level . . . ‘Key Support Level for Fib_8 Targeting’

Reinforcing price relative to Trough Fib_21 Price Level:
- above is positive and in a position to achieve Fib_8 targeting, check other relationship components (true on any fractal)
- crossing below is negative and establishes proof-point to cross for upside continuance or (true on any fractal)
- above but under Trough Fib17_21 Fence is in a upside retracement potential zone for move to Fib_8 Target, Fib17_21 Fence/proof-point levels, etc (true on any fractal)
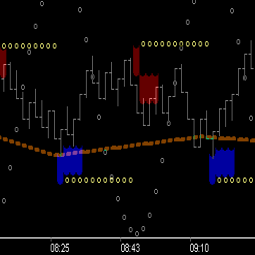
Adding Trough Momentum Cap/Cup Level directionally filtered with Fib17_21 Fence . . . ‘Key Support Level for Fib_8 Targeting’

Reinforcing price relative to Trough Momentum:
- above is positive and in a position to achieve Fib_8 targeting, check other relationship components (true on any fractal)
- crossing below is negative and establishes proof-point to cross for upside continuance (true on any fractal)
- crossing above but under Trough Fib17_21 Fence is in an upside retracement potential zone for move to Fib_8 Target, Fib17_21 Fence/proof-point levels, etc (true on any fractal)

Reinforcing price relative to Crest Momentum:
- above is positive and in a position to achieve Fib_8 targeting, check other relationship components (true on any fractal)
- crossing below is negative and establishes proof-point to cross for upside continuance (true on any fractal)
- crossing above but under Trough Fib17_21 Fence is in a upside retracement potential zone for move to Fib_8 Target, Fib17_21 Fence/proof-point levels, etc (true on any fractal)
- Crest Momentum Origin is consistent pulsing point of Time . . . Up or Down (true on any fractal)
Success comes as you make it your own . . . using as little or as much information as you need.
Remembering of course . . .
It is to your advantage to always know where the Time Fence 45’s are . . . ‘Break-Outs and Bracketing’

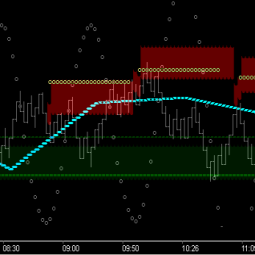
Now back to the large fractal 21 chart at the top of this thread. Price’s position opening on the 12th was known as positive bias, and price’s position on the 13th had a negative bias (capped). The same logic used for the upside picture painted on the fractal 13 chart is used to paint the downside picture . . . substituting the Crest Fib components of vibration.

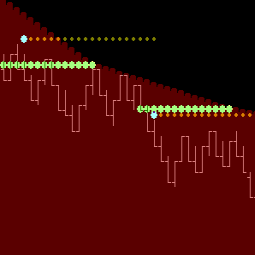
Reinforcing price relative to Crest Fib_21 (dark red) & 17 (red) Price Levels:
- below is negative and in a position to achieve downside Fib_8 targeting, check other relationship components (true on any fractal)
- crossing above is positive and establishes proof-point to cross for downside continuance (true on any fractal)
- below but above Trough Fib17_21 Fence is in a bracketed zone for potential move to Fib_8 Target, Fib17_21 Fence/proof-point levels, etc (true on any fractal)
- above Trough Fib17_21 Fence . . . downside momentum is muted until crossing back over for continuance (true on any fractal)
Revisiting the Large Fractal 21 Tick Chart . . . the Fib 21 levels . . . Trough and Crest . . . the 45 diagonal of the Square of 9 . . . Support/Resistance . . . (true on any fractal).

Note the churning of price on the 21 fractal (10:36-11:46) . . . until price ran into the Crest Fib_21 level on the 13 Fractal at 12:00 and could not break-out. Resistance on the larger fractal held by ‘new’ resistance at time of the medium fractal.
Summary. . . Fib17_21 Fence:
Is best to Trade With It!